



Large caps, mid caps and small caps are labels, and the labels move. Every six months a batch of companies changes bucket, and within each bucket the spread between winners and losers has been wide in 2026.
This guide explains how the categories are defined, what seven and a half years of index data showed, why the current market rewards selection over labels, and how to size each slice of a portfolio in rupees instead of percentages. The portfolio examples are hypothetical.
What large cap, mid cap and small cap mean
Under SEBI’s framework, companies are ranked by full market capitalization. The top 100 are large caps, ranks 101 to 250 are mid caps, and everything from 251 onward is a small cap. AMFI revises the list every January and July using six-month average market caps, so a stock’s label can change between reviews.
| Category | Rank by market cap | Approximate cut-off (July 2026 review) |
| Large cap | 1 to 100 | About ₹1.06 lakh crore |
| Mid cap | 101 to 250 | About ₹33,500 crore |
| Small cap | 251 onward | Below ₹33,500 crore |
The July 2026 review moved eight stocks from mid cap to large cap and nine the other way, ten from mid cap to small cap, and six from small cap to mid cap. Average market caps fell in all three buckets, with small caps seeing the sharpest drop at about 9%.
Large cap vs mid cap vs small cap: what the data showed
From January 2019 to August 2026, the Nifty Midcap 150 compounded at about 19% a year, against 11 to 12% for the Nifty 50. Small caps earned about 18% but fell furthest in the March 2020 crash. The period includes a strong mid and small cap bull run, so treat the gap as history, not a forecast.
| Index | Annual return, Jan 2019 to Aug 2026 | Worst fall (March 2020) | What stood out |
| Nifty 50 | 11 to 12% | About 38% | Calmest day to day, yet still fell about 38% |
| Nifty Midcap 150 | About 19% | 36 to 40% | Recovered to a new high fastest |
| Nifty Smallcap 250 | About 18% | About 46% | Took 591 trading days to recover, and 28% of one-year holds ended in a loss |
A hypothetical ₹100 put into the Midcap 150 in January 2019 grew to almost ₹380, while the same amount in the Nifty 50 grew to roughly ₹220 to ₹230. The figures are price returns without dividends, so a fund tracking these indexes would show slightly different results.
Why this is a stock-picker’s market
Large caps lagged in 2026. As of 10 September, the Nifty 50 was down 10.2% for the year, while the Nifty Midcap 100 was up 2.6% and the Nifty Smallcap 100 up 13.0%.

Within categories, results diverged more. FY26 mid-cap funds ranged from a gain of 11.1% to a loss of 12.9%. In the March 2026 quarter, earnings grew 40.7% year on year for the Nifty Midcap 150, against 8.5% for the Smallcap 250 and 9.6% for the Nifty 100.
When the gap inside a category is wider than the gap between categories, the label tells you less than the specific holding does. That is the practical meaning of a stock-picker’s market.
Portfolio allocation by market cap: size slices in rupees
In the March 2020 crash, most Indian equity indexes fell 36% to 40% and small caps fell about 46%, so market cap mix changed a portfolio’s worst fall by at most about ten points. The useful question is how much of your portfolio sits in the segment that fell furthest, and what that fall would cost in rupees.
The table assumes a ₹10 lakh equity portfolio and a 46% fall in the small-cap slice.
| Small-cap share | Amount in small caps | Loss if small caps fall 46% | Hit to total portfolio |
| 10% | ₹1,00,000 | ₹46,000 | 4.6% |
| 20% | ₹2,00,000 | ₹92,000 | 9.2% |
| 30% | ₹3,00,000 | ₹1,38,000 | 13.8% |
Now compare two mixes, assuming a 38% fall in everything outside small caps. A 10% small, 20% mid and 70% large mix falls about 38.8%. A 20% small, 30% mid and 50% large mix falls about 39.6%. The mix moved the result by under one point.

The bigger lever is how much of your total money is in equity at all. If equity is 60% of the portfolio and the rest sits in debt that holds its value, a 39.6% equity fall becomes a fall of about 23.8% overall.
How to diversify a portfolio when the segments move together
Across the seven Nifty indexes studied, nearly every pair had a correlation between 0.80 and 1.00. The lowest was Nifty 50 against Smallcap 250 at 0.76. Owning a large, a mid and a small cap fund spreads the risk less than it appears.
The Nifty 500 shows why. Roughly two-thirds of its weight sits in the top 100 companies, and almost half in the Nifty 50, so a “broad” index behaves much like a large-cap one.
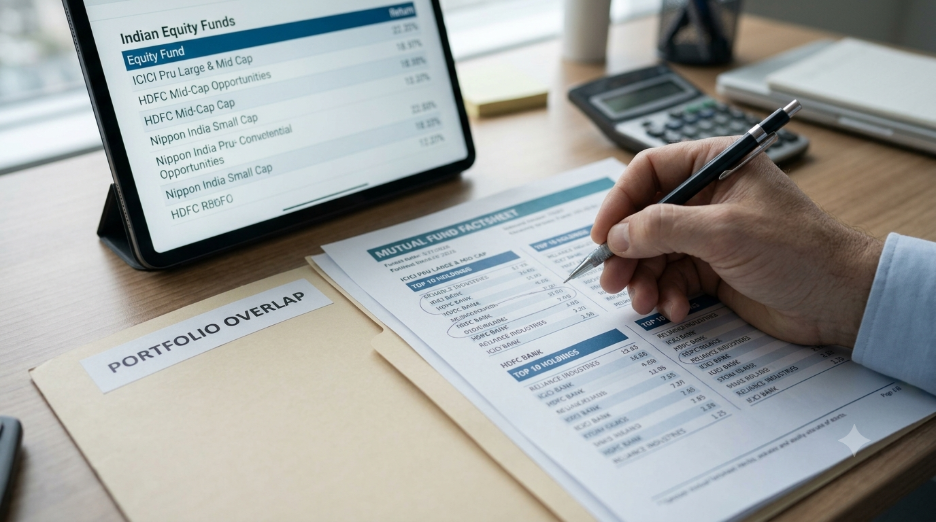
Real diversification comes from other places: asset classes such as debt and gold, sectors, the number of distinct holdings inside each segment, and time, by investing regularly instead of in one lump sum. Overlap matters too. Check whether your funds hold the same top stocks, because two funds with different labels can own much of the same portfolio. For practical guidance, read how to diversify a portfolio with mutual funds and assess how your holdings work together.
What these figures leave out
The index data is a single 7.5-year window that starts before a strong mid and small cap run. A different window would give different returns. Index figures also exclude fund costs and taxes, and the 46% fall is a past event, not a floor.
Category boundaries are blunt. A stock just under the large-cap cut-off behaves more like a large cap than a small one, and the AMFI list re-sorts every six months. Hybrid, sectoral and international funds follow other rules and are not covered.
List every fund and stock you hold, tag each as large, mid or small using the latest AMFI list, and total the rupees in each bucket. To check your funds’ holdings, costs and investment approach, learn how to read a mutual fund factsheet. Then calculate the loss on the small-cap slice at 46% and decide whether you could hold through it without changing your plans.
*This article is educational and is not investment advice. Portfolio examples are hypothetical.
FAQs
What is the difference between large cap, mid cap and small cap?
Companies are ranked by full market capitalization. The top 100 are large caps, ranks 101 to 250 are mid caps, and the rest are small caps. AMFI updates the list every January and July, so a company’s category can change.
Which is better, large cap, mid cap or small cap?
Neither wins in every period. From January 2019 to August 2026, mid and small caps returned more per year than large caps, but small caps fell furthest in the 2020 crash and took longest to recover. The right mix depends on how large a fall you can hold through.
How do I diversify a portfolio across market caps?
Size each slice by the rupee loss you could accept, not by a target percentage. Large, mid and small cap indexes moved closely together in the 2020 crash, so also spread across asset classes, sectors and time through regular investing.